---
title: Data Denormalization Made Easy
description: In this blog we address normalization and how to use Power BI Query Editor Value and Table Columns to make “denormalization” easy.
image: https://www.teamscs.com/hubfs/Imported_Blog_Media/blog-img-generic-03-4.jpg
---
[Skip to main content](https://www.teamscs.com/superior-spotlight-blogs/2017/05/power-bi-query-editor-value-and-table-columns-or-data-denormalization-made-easy#main-content)
- [Power BI Consulting](https://www.teamscs.com/power-bi-enterprise)
- [Request a Quote](https://www.teamscs.com/discovery)
[ ](https://www.teamscs.com/old-homepage)
- Show submenu for Data Services Data Services
- [Data Unification](https://www.teamscs.com/data-unification)
- [Data Modeling](https://www.teamscs.com/data-modeling)
- [Data Visualization](https://www.teamscs.com/reporting-and-analytics)
- [Spatial Analytics](https://www.teamscs.com/gis-spatial-analytics)
- [Business Automation](https://www.teamscs.com/business-automation)
- [AI & Machine Learning](https://www.teamscs.com/ai-machine-learning)
- Show submenu for Technologies Technologies
- [Power BI & Analytics](https://www.teamscs.com/power-bi-enterprise)
- [Microsoft Fabric](https://www.teamscs.com/microsoft-fabric-consulting)
- [Microsoft Azure](https://www.teamscs.com/azure-services)
- [Power Apps & Power Automate](https://www.teamscs.com/power-apps-power-automate)
- Show submenu for Industries Served Industries Served
- [Community Corrections](https://www.teamscs.com/community-corrections)
- [Financial Institutions](https://www.teamscs.com/financial-institutions)
- [Government Contracting](https://www.teamscs.com/government-contracting)
- [HHS Departments](https://www.teamscs.com/county-hss-departments)
- [Insurance Companies](https://www.teamscs.com/insurance-industry)
- [Manufacturing](https://www.teamscs.com/manufacturing)
- [Nonprofits](https://www.teamscs.com/nonprofits)
- [SaaS Companies](https://www.teamscs.com/software-as-a-service)
- [Service Providers](https://www.teamscs.com/service-providers)
- Show submenu for About Us About Us
- [Meet the Team](https://www.teamscs.com/about)
- [The Superior Way](https://www.teamscs.com/superior-way)
- [Case Studies](https://www.teamscs.com/superior-spotlight-blogs/tag/case-studies)
- [Testimonials](https://www.teamscs.com/insights/testimonials)
- Show submenu for Training Training
- [Power BI & Fabric Training](https://www.teamscs.com/custom-training)
- [Online Courses](https://www.teamscs.com/learn-power-bi)
- [User Groups and Events](https://www.teamscs.com/user-groups-and-events)
- Show submenu for Resources Resources
- [Superior Blog](https://www.teamscs.com/superior-spotlight-blogs)
- [Published Books](https://www.teamscs.com/insights/resources)
- [Contact](https://www.teamscs.com/contact)
Open main navigation
Close main navigation
- Show submenu for Data Services Data Services
- Data Services
- [Data Unification](https://www.teamscs.com/data-unification)
- [Data Modeling](https://www.teamscs.com/data-modeling)
- [Data Visualization](https://www.teamscs.com/reporting-and-analytics)
- [Spatial Analytics](https://www.teamscs.com/gis-spatial-analytics)
- [Business Automation](https://www.teamscs.com/business-automation)
- [AI & Machine Learning](https://www.teamscs.com/ai-machine-learning)
- Show submenu for Technologies Technologies
- Technologies
- [Power BI & Analytics](https://www.teamscs.com/power-bi-enterprise)
- [Microsoft Fabric](https://www.teamscs.com/microsoft-fabric-consulting)
- [Microsoft Azure](https://www.teamscs.com/azure-services)
- [Power Apps & Power Automate](https://www.teamscs.com/power-apps-power-automate)
- Show submenu for Industries Served Industries Served
- Industries Served
- [Community Corrections](https://www.teamscs.com/community-corrections)
- [Financial Institutions](https://www.teamscs.com/financial-institutions)
- [Government Contracting](https://www.teamscs.com/government-contracting)
- [HHS Departments](https://www.teamscs.com/county-hss-departments)
- [Insurance Companies](https://www.teamscs.com/insurance-industry)
- [Manufacturing](https://www.teamscs.com/manufacturing)
- [Nonprofits](https://www.teamscs.com/nonprofits)
- [SaaS Companies](https://www.teamscs.com/software-as-a-service)
- [Service Providers](https://www.teamscs.com/service-providers)
- Show submenu for About Us About Us
- About Us
- [Meet the Team](https://www.teamscs.com/about)
- [The Superior Way](https://www.teamscs.com/superior-way)
- [Case Studies](https://www.teamscs.com/superior-spotlight-blogs/tag/case-studies)
- [Testimonials](https://www.teamscs.com/insights/testimonials)
- Show submenu for Training Training
- Training
- [Power BI & Fabric Training](https://www.teamscs.com/custom-training)
- [Online Courses](https://www.teamscs.com/learn-power-bi)
- [User Groups and Events](https://www.teamscs.com/user-groups-and-events)
- Show submenu for Resources Resources
- Resources
- [Superior Blog](https://www.teamscs.com/superior-spotlight-blogs)
- [Published Books](https://www.teamscs.com/insights/resources)
- [Contact](https://www.teamscs.com/contact)
- [Power BI Consulting](https://www.teamscs.com/power-bi-enterprise)
- [Request a Quote](https://www.teamscs.com/discovery)
# Data Denormalization Made Easy
###### May 10, 2017

## *Power BI Query Editor Value and Table Columns*
Data stored as part of a transactional data processing system, for example a database to information on package deliveries, is often difficult to work with when it comes time to explore that data or create reports. This is because of a process called normalization.
### Data Normalization
When any database developer worth his or her salt designs a transactional database, they apply the rules of data normalization. These rules find values that are repeated within the data and store those values in separate tables. Smaller, more efficient ID values are placed in the original table and the new table so the records in these tables maintain an association called a relationship. This allows the database to take up less space and makes it easier to insert new values and update existing values.
For example, each delivery has customer information associated with it (Shown in the Before Normalization Delivery table below.) However, we don’t want to repeat the customer name, city, and other information in each and every record in our Delivery table. Instead we create a Customer table and use a Customer Number to link Customer table records to Delivery table records. (Shown in the After Normalization Delivery and Customer tables below.)
**Before Normalization Delivery Table**
| **Deliver Number** | **Pickup Date/Time** | **Customer Name** | **City** |
| --- | --- | --- | --- |
| 123833 | 9/22/2014 11:57pm | Rosenblinker, Inc | Osmar |
| 123841 | 11/14/2014 8:57pm | Rosenblinker, Inc | Osmar |
| 123878 | 11/30/2014 7:57pm | Bolimite, Mfg | Axelburg |
**After Normalization Delivery Table**
| **Deliver Number** | **Pickup Date/Time** | **Customer Number** |
| --- | --- | --- |
| 123833 | 9/22/2014 11:57pm | 123833 |
| 123841 | 11/14/2014 8:57pm | 123833 |
| 123878 | 11/30/2014 7:57pm | 263722 |
**Customer Table**
| **Customer Number** | **Customer Name** | **City** |
| --- | --- | --- |
| 123833 | Rosenblinker, Inc | Osmar |
| 263722 | Bolimite, Mfg | Axelburg |
### Data Denormalization
Data normalization works great when we are trying to create an efficient transactional processing system and utilize the smallest amount of disk space. However, if we want to create a report on the deliveries completed for each customer, we must put these separate tables back together. In most cases we won’t have all of the individual customer numbers memorized. We need to see the customer names.
One way to do this in our Power BI data model is to load both the Delivery table and the Customer table. These would then exist as two separate tables in data model. However, if our source database is configured properly, Power BI offers an alternative way of handling this situation using the Value column.
### The Value Column
If our source database includes a defined relation (foreign key constraint) between the Delivery table and the Customer table, the Power BI query editor will include special a column for us. This column brings all the values from the related table into the main table in a column that contains the word “Value” in each row and has this symbol  on the right side of the column heading.
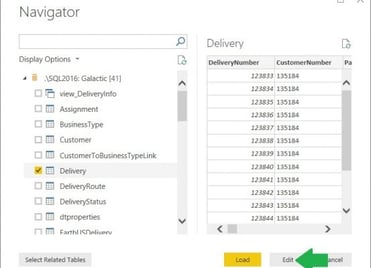
Here’s how to work with these special Value columns. We begin loading data into our data model by selecting the Delivery table, and then clicking edit.
[](https://www.teamscs.com/hubfs/Imported_Blog_Media/Power-BI-Value-and-Table-Columns-Figure-01-1.jpg)
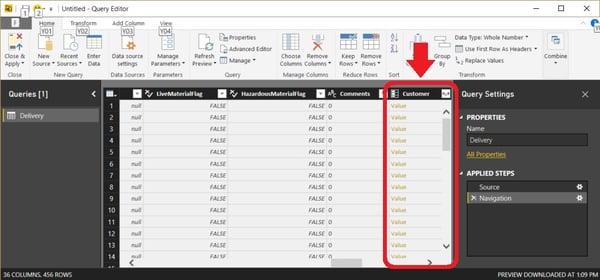
This will take us to the Query Editor window with the Deliver table loaded. There will be a Value column called Customer to the right of all the “regular” data columns in the table.
[](https://www.teamscs.com/hubfs/Imported_Blog_Media/Power-BI-Value-and-Table-Columns-Figure-02-1.jpg)
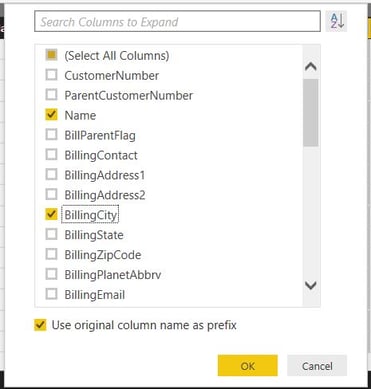
Clicking the  symbol displays a popup dialog box showing all the columns from the Customer table that could be pulled into the Delivery table. In this example, we want to include the customer name and the city (in this case called BillingCity) in the Delivery table.
[](https://www.teamscs.com/hubfs/Imported_Blog_Media/Power-BI-Value-and-Table-Columns-Figure-03-1.jpg)
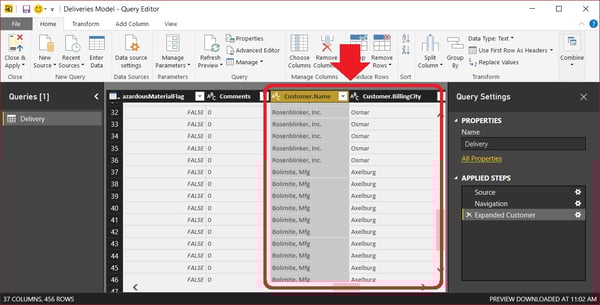
Once we click OK, the Values column is replaced by the columns we selected. The original table name, Customer, and the column name from that table, Name and BillingCity, are combined with a “.” in between to create the names for these new columns.
[](https://www.teamscs.com/hubfs/Imported_Blog_Media/Power-BI-Value-and-Table-Columns-Figure-04-1.jpg)
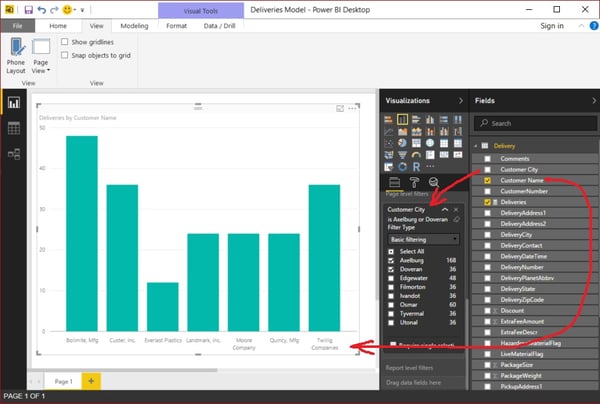
We can rename these columns to something that is more natural. In this case, perhaps “Customer Name” and “Customer City”. The Power BI data compression routines efficiently handle the repeated values we added to the Delivery table, so we are not adding a great deal of overhead to our data model.
Having the Customer Name and Customer City right in the Delivery table makes it easy to slice and filter the delivery measures by these values.
[](https://www.teamscs.com/hubfs/Imported_Blog_Media/Power-BI-Value-and-Table-Columns-Figure-05-1.jpg)
#### When Not to Use Value Columns
As you can see, Value columns make it very easy to combine related data into a given table. This can not only streamline the model creation process, but it can make our models easier to work with having fewer table to look through for a given value. There are a couple situations, however, where this may not be the best approach for handling related data.
##### *A Large Number of Related Columns Must Be Included*
In the example shown, only the Customer Name and Customer City data was needed to slice and filter delivery information. In this case, it makes sense to include those columns right in the Delivery table. If we had a situation where many different columns from the Customer table may be used at different times to slice and filter delivery information, it might be better pull in the Customer data as a separate table and relate it to the Delivery table. This will keep our Delivery table from getting too overwhelming and difficult to work with.
##### *The Related Data Must Slice and Filter Multiple Tables*
In the example shown, we were only concerned with slicing and filtering delivery information. In a more complex data model, we might have an additional table containing invoice information. In that case, we would want to slice and filter both the delivery information the invoice information by Customer Name. Rather than having Customer Name appear in both the Delivery table and the Invoice table, we will want to pull in the Customer data as a separate table and relate it to both the Delivery table and the Invoice table.
### The Table Column
In the delivery to customer relationship in the previous example, each delivery is done for a single customer. Therefore, our Value column has only one value for Customer Name and Customer City. In some cases, however, a single record can relate to multiple records in another table. For example, we may have a table with one record for each stop (delivery hub) a package makes as it is being routed from the pickup location to its ultimate destination. This table would store the package tracking information we are used to seeing.
In this scenario, a single Delivery is related to multiple stops, thus multiple records, along the delivery route. Now, we see a different type of special column in the Query Editor window. This field has the word “Table” in every in each row. However, it still has the same  symbol to the right of the column heading.
[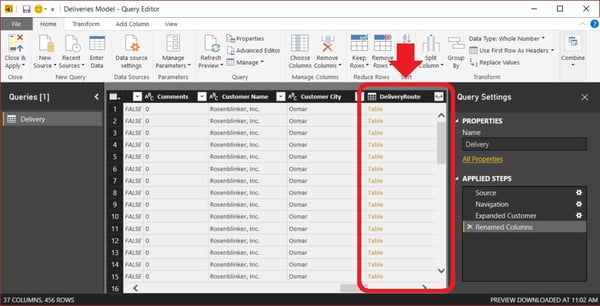](https://www.teamscs.com/hubfs/Imported_Blog_Media/Power-BI-Value-and-Table-Columns-Figure-06-1.jpg)
Clicking the  symbol brings up a similar popup dialog box showing the columns from the related table. As before, we can select columns to be pulled into the Delivery table. For our example, we will include delivery hub code and the time the package reached each hub.
[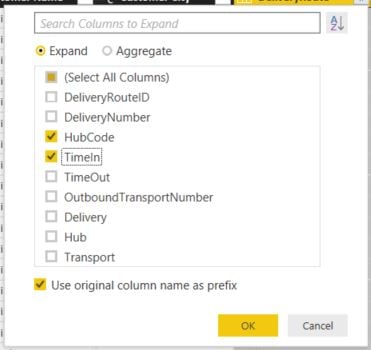](https://www.teamscs.com/hubfs/Imported_Blog_Media/Power-BI-Value-and-Table-Columns-Figure-07-1.jpg)
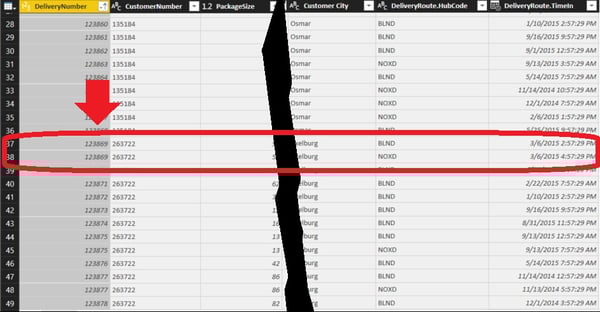
When we click OK, DeliveryRoute.TimeIn and DeliveryRoute.Hub are added as new columns in our table. In addition, there are also new rows added to the table. In our example, we had one row for Delivery Number 123869 in the Delivery table. After expanding the pulling in the fields from the DeliveryRoute table, we now have two rows Delivery Number 123869. The reason for this is the delivery when through two hubs, one with hub code “BLND” and the other, two hours later, with hub code “NOXD”. All of the data originally from the Delivery table for Delivery Number 123869 is repeated in these two rows.
[](https://www.teamscs.com/hubfs/Imported_Blog_Media/Power-BI-Value-and-Table-Columns-Figure-08-1.jpg)
When you expand a “Table” column, be sure to update your model appropriately to ensure it will properly handle the duplicate data that will result. For instance, our Deliveries measure was using the expression:
Delivery = COUNT(Delivery\[DeliveryNumber\])
to get the number of deliveries. Now we need to use the expression:
Deliveries = DISTINCTCOUNT(Delivery\[DeliveryNumber\])
to avoid double counting deliveries like Delivery Number 123869.
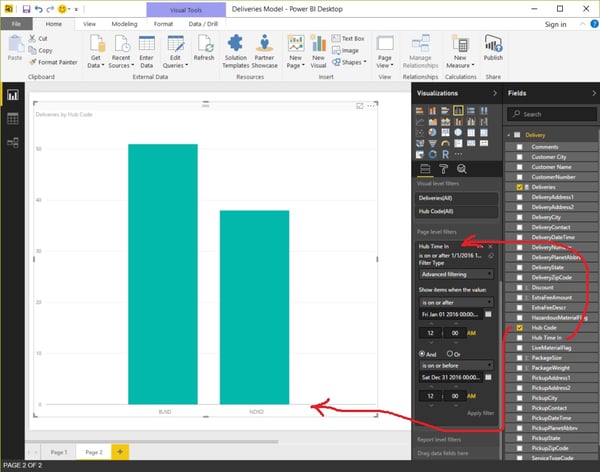
After pulling in the columns from the DeliveryRoute table, it is easy to slice and filter the data by Hub Code and Hub Time In.
[](https://www.teamscs.com/hubfs/Imported_Blog_Media/Power-BI-Value-and-Table-Columns-Figure-09-1.jpg)
### Conclusion
The Value and Table columns in the Power BI Query Editor can provide a quick and easy way to take fields from related tables and pull them in as columns into a main table. Use them wisely, and they can streamline your model creation process.
###### Tags:
[Coding,](https://www.teamscs.com/superior-spotlight-blogs/tag/coding) [Denormalization](https://www.teamscs.com/superior-spotlight-blogs/tag/denormalization)
[](https://www.teamscs.com/old-homepage)
350 West Burnsville Parkway, Suite 550
Burnsville, MN 55337
[scs@teamscs.com](mailto:scs@teamscs.com)
[952.890.0606](tel:9528900606)
-
-
-
- [Careers](https://www.teamscs.com/superior-consulting-careers)
- [Power BI Consulting and Support](https://www.teamscs.com/power-bi-enterprise)
- [Fabric Consulting](https://www.teamscs.com/microsoft-fabric-consulting)
- [Azure Services](https://www.teamscs.com/azure-services)
- [Power Apps & Power Automate Services](https://www.teamscs.com/power-apps-power-automate)
- [Data Unification & Modernization](https://www.teamscs.com/data-unification)
- [Data Modeling](https://www.teamscs.com/data-modeling)
- [Reporting & Analytics](https://www.teamscs.com/reporting-and-analytics)
- [GIS & Spatial Analytics](https://www.teamscs.com/gis-spatial-analytics)
- [Business Automation & Workflow](https://www.teamscs.com/business-automation)
- [Government Contracting](https://www.teamscs.com/government-contracting)
- [HHS Departments](https://www.teamscs.com/county-hss-departments)
- [Community Corrections](https://www.teamscs.com/community-corrections)
- [Manufacturing](https://www.teamscs.com/manufacturing)
- [Insurance Companies](https://www.teamscs.com/insurance-industry)
- [Financial Institutions](https://www.teamscs.com/financial-institutions)
- [Nonprofits](https://www.teamscs.com/nonprofits)
- [Service Providers](https://www.teamscs.com/service-providers)
- [SaaS Companies](https://www.teamscs.com/software-as-a-service)
Copyright © 2026 Superior Consulting Services | All Rights Reserved | [Privacy Policy](http://23673295.hs-sites.com/privacy-policy) | [Terms of Use](https://www.teamscs.com/terms-of-use) | Minneapolis Web Design by Bizzyweb
```json
{
"@context" : "https://schema.org",
"@type" : "BlogPosting",
"author" : {
"@type" : "Person",
"name" : "Brian Larson",
"url" : "https://www.teamscs.com/superior-spotlight-blogs/author/brian-larson"
},
"dateModified" : "2023-07-07T15:45:37.489Z",
"datePublished" : "2017-05-10T10:31:10.000Z",
"headline" : "Data Denormalization Made Easy",
"image" : [ "https://www.teamscs.com/hubfs/Imported_Blog_Media/blog-img-generic-03-4.jpg" ],
"mainEntityOfPage" : {
"@id" : "https://www.teamscs.com/superior-spotlight-blogs/2017/05/power-bi-query-editor-value-and-table-columns-or-data-denormalization-made-easy",
"@type" : "WebPage"
},
"publisher" : {
"@type" : "Organization",
"logo" : {
"@type" : "ImageObject",
"url" : "https://www.teamscs.com/hubfs/SCS_2015_LOGO.svg"
},
"name" : "Superior Consulting Services"
}
}
```